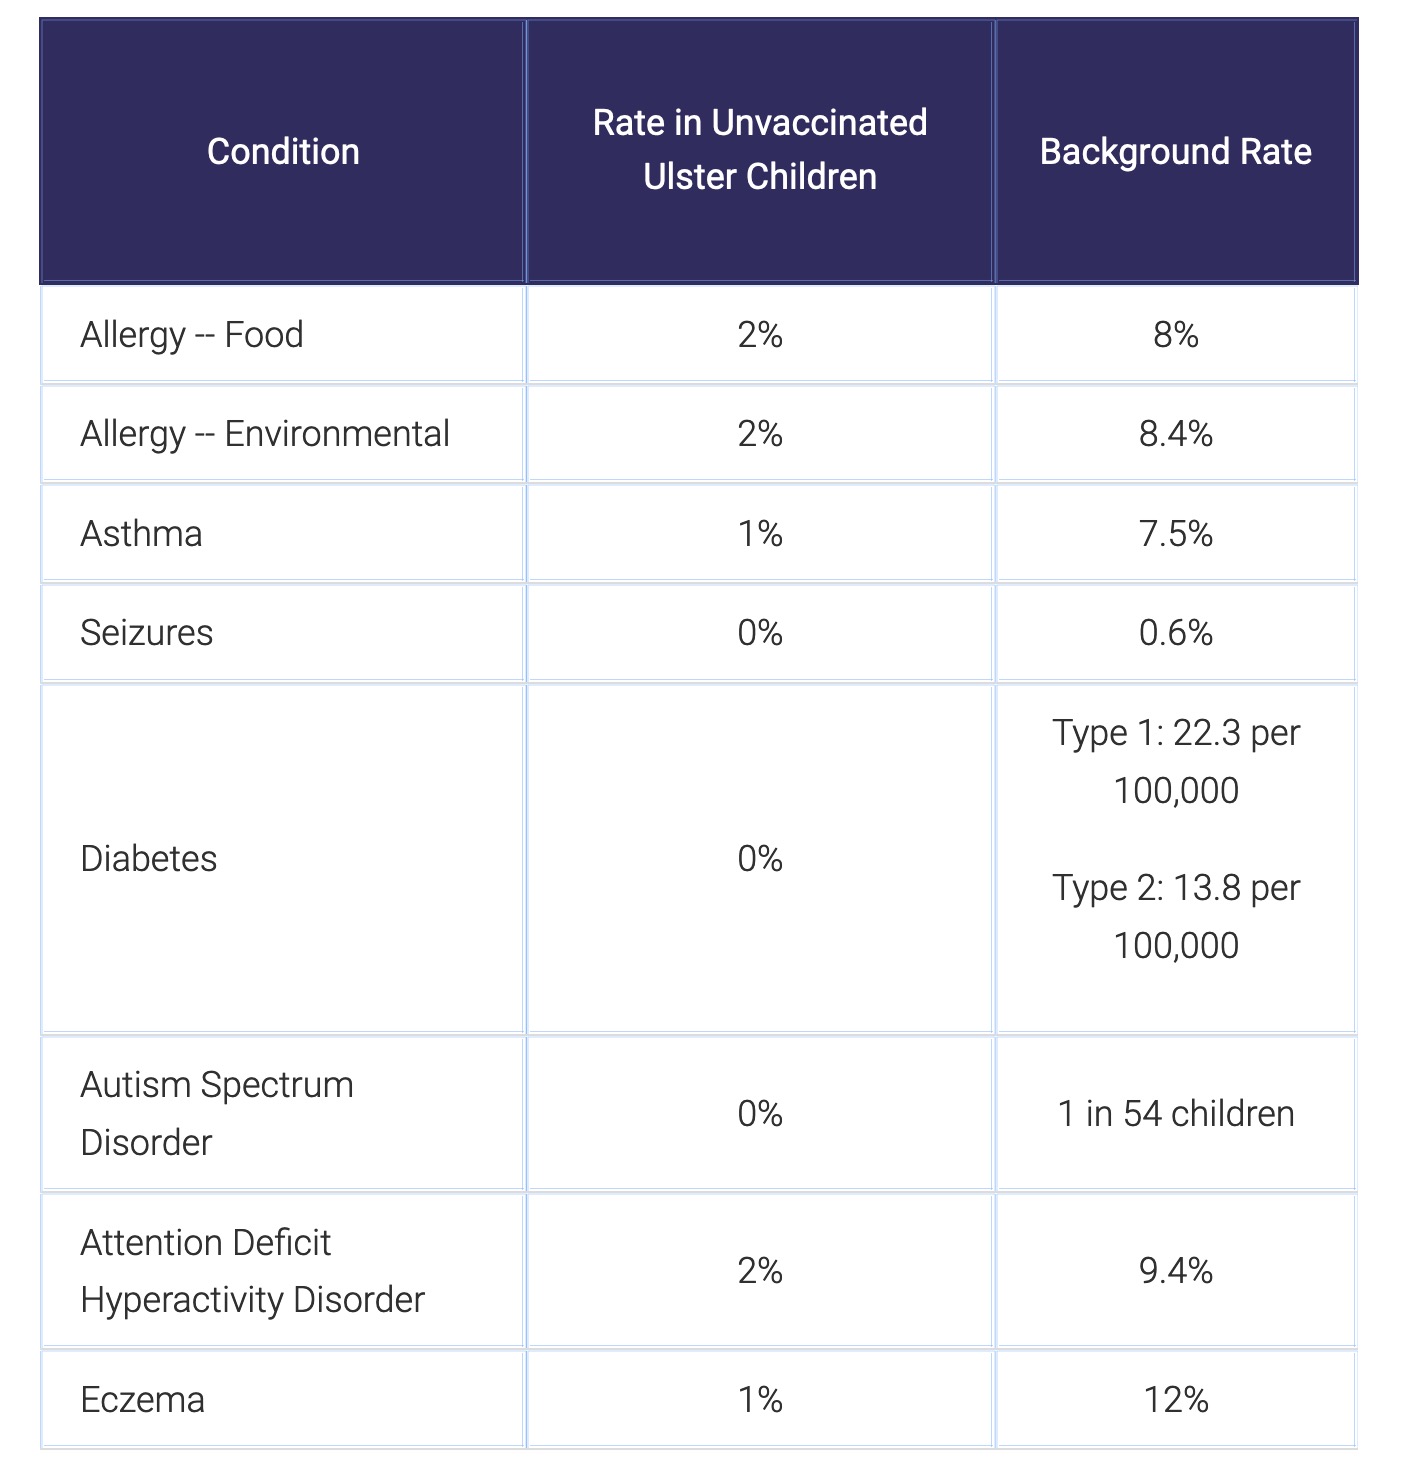
Unvaccinated vs. Background rate (typically vaccinated)
Leave a reply
The Institute of Medicine (IOM) has repeatedly asked CDC to create studies which explain,
“How do child health outcomes compare between fully vaccinated and unvaccinated children?”
During a November 2012 Congressional hearing on autism before the House Committee on Oversight and Government Reform, Dr. Coleen Boyle, the Director of the National Center on Birth Defects and Developmental Disabilities, gave evasive answers to lawmakers pressing her on this point. After considerable badgering, she finally stated,
“We have not studied vaccinated versus unvaccinated [children].”
That was perjury.
Boyle knew that CDC had commissioned an in-house researcher, Thomas Verstraeten to perform vaccinated/unvaccinated study on CDC’s giant Vaccine Safety Datalink (VSD) in 1999 (I summarize Verstraeten’s secret findings on slide 2).
Verstraeten found a dramatic link between mercury-containing hepatitis B vaccines and several neurological injuries including autism and prepared the study for publication. CDC shared Verstraeten’s analysis with the then four vaccine makers but kept it secret from the American public.
The data in CDC’s 1999 Verstraeten study clearly inculpated thimerosal as the principle culprit behind the autism epidemic.

From about 8% to 27% of extremely preterm infants develop symptoms of autism spectrum disorder, but the causes are not well understood. Preterm infants receive the same doses of the recommended vaccines and on the same schedule as term infants. The possible role of vaccination in neurodevelopmental disorders (NDD) among premature infants is unknown, in part because pre-licensure clinical trials of pediatric vaccines have excluded ex-preterm infants. This paper explores the association between preterm birth, vaccination and NDD. READ STUDY…
Published in The Journal of Translational Science which were funded in part by Children’s Medical Safety Research Institute.
The children as a group were similarly mostly white (88%), with a slight preponderance of females (52%), and averaged 9 years of age. With regard to vaccination status, 261 (39%) were unvaccinated, 208 (31%) were partially vaccinated, and 197 (30%) had received all of the recommended vaccinations. All statistical analyses are based on these numbers.
Vaccinated children (N=405), combining the partially and fully vaccinated, were significantly less likely than the unvaccinated to have had chickenpox (7.9% vs. 25.3%, p <0.001; Odds Ratio = 0.26, 95% Confidence Interval: 0.2, 0.4) and whooping cough (pertussis) (2.5% vs. 8.4%, p <0.001; OR 0.3, 95% CI: 0.1, 0.6), and less likely, but not significantly so, to have had rubella (0.3% vs. 1.9%, p = 0.04; OR 0.1, 95% CI: 0.01, 1.1). However, the vaccinated were significantly more likely than the unvaccinated to have been diagnosed with otitis media (19.8% vs. 5.8%, p <0.001; OR 3.8, 95% CI: 2.1, 6.6) and pneumonia (6.4% vs. 1.2%, p = 0.001; OR 5.9, 95% CI: 1.8, 19.7). No significant differences were seen with regard to hepatitis A or B, high fever in the past 6 months, measles, mumps, meningitis (viral or bacterial), influenza, or rotavirus (Table 2).
Chronic Illnesses:
Vaccinated children were significantly more likely than the unvaccinated to have been diagnosed with the following: allergic rhinitis (10.4% vs. 0.4%, p <0.001; OR 30.1, 95% CI: 4.1, 219.3), other allergies (22.2% vs. 6.9%, p <0.001; OR 3.9, 95% CI: 2.3, 6.6), eczema/atopic dermatitis (9.5% vs. 3.6%, p = 0.035; OR 2.9, 95% CI: 1.4, 6.1), a learning disability (5.7% vs. 1.2%, p = 0.003; OR 5.2, 95% CI: 1.6, 17.4), ADHD (4.7% vs. 1.0%, p = 0.013; OR 4.2, 95% CI: 1.2, 14.5), ASD (4.7% vs. 1.0%, p = 0.013; OR 4.2, 95% CI: 1.2, 14.5), any neurodevelopmental disorder (i.e., learning disability, ADHD or ASD) (10.5% vs. 3.1%, p <0.001; OR 3.7, 95% CI: 1.7, 7.9) and any chronic illness (44.0% vs. 25.0%, p <0.001; OR 2.4, 95% CI: 1.7, 3.3). No significant differences were observed with regard to cancer, chronic fatigue, conduct disorder, Crohn’s disease, depression, Types 1 or 2 diabetes, encephalopathy, epilepsy, hearing loss, high blood pressure, inflammatory bowel disease, juvenile rheumatoid arthritis, obesity, seizures, Tourette’s syndrome, or services received under the Individuals with Disabilities Education Act (Table 3).
(n=261)
Chi-square
P-value
The Vaccinated had a Higher rate of Allergies and Autism Spectrum Disorder, Attention Deficit Hyperactivity Disorder, and/or a learning disability (NDD) than the Unvaccinated.
ALERT: Editors’ Note Appended 11/28/16: The survey mentioned was taken directly from the Frontiers in Public Health website. The published abstract was recently deleted from their website. The cached images of the survey has been saved on this link: READ MORE…
 According to a report published on Friday, January 11, 2013, by Natural News, children who have been fully vaccinated according to the CDC recommended schedule are up to five times more likely to develop various diseases compared with children who have not received full immunizations. Read more…